Strength-Duration Curve (SD Curve)
Introduction
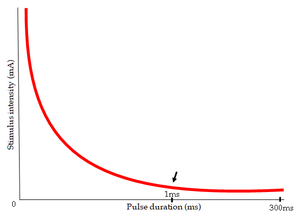
The Strength-Duration Curve (SD Curve) visually represents the connection between the intensity of an electrical stimulus applied to a muscle’s motor point and the time required to trigger a minimal contraction in that muscle.
In this context, “strength” pertains to the intensity of the stimulus plotted on the vertical axis, while “duration” refers to the pulse length on the horizontal axis. This curve is a diagnostic tool for assessing nerve damage in cases of lower motor neuron lesions.
The Strength-Duration Curve: A Deep Dive into Neuromuscular Excitability
The Strength-Duration (SD) curve, although it appears straightforward, contains extensive information regarding the complex functions of the neuromuscular system. It illustrates the connection between the intensity and the duration of an electrical stimulus needed to provoke a minimal muscle contraction.
This curve is not merely an academic exercise; it acts as an essential diagnostic instrument, revealing details about nerve integrity, muscle performance, and the overall condition of the neuromuscular system.
This article examines the details of the SD curve, investigating its foundational principles, clinical uses, limitations, and significance in enhancing our grasp of neuromuscular physiology.
Foundations of the SD Curve: Physiology and Electrophysiology
The SD curve is based on the basic tenets of electrophysiology and muscle physiology. Muscle contraction begins with the depolarization of the muscle cell membrane, initiating a sequence of events that lead to the interaction of actin and myosin filaments. This depolarization can occur through several mechanisms, including the arrival of a nerve impulse at the neuromuscular junction or, as illustrated by the SD curve, through the application of an external electrical stimulus.
Applying an electrical stimulus to a muscle excites both the nerve fibers that innervate the muscle and the muscle fibers themselves. The intensity and duration of the stimulus are critical factors that influence whether a muscle contraction will occur. The SD curve effectively illustrates this relationship.
Stimulus Intensity: This refers to the strength of the electrical current, generally measured in milliamperes (mA) or volts (V). A stimulus with higher intensity typically recruits more nerve and muscle fibers, increasing the chances of provoking a contraction.
Stimulus Duration: This relates to the length of time the electrical current is applied, usually measured in milliseconds (ms). A stimulus with a longer duration permits a more extended depolarization of the nerve and muscle membranes, also enhancing the likelihood of a contraction.
The SD curve is established by systematically altering the stimulus duration and determining the lowest intensity necessary to induce a barely noticeable muscle contraction for each duration. These data points are subsequently plotted on a graph, with stimulus intensity on the vertical axis and stimulus duration on the horizontal axis.
The Strength-Duration Curve: A Deep Dive into Neuromuscular Excitability
The Strength-Duration (SD) curve, albeit a seemingly simple graphical depiction, encapsulates a significant amount of information about the complex functions of the neuromuscular system. It charts the relationship between the intensity and duration of an electrical stimulus that is required to evoke a minimal muscle contraction.
This curve extends beyond being just a laboratory demonstration; it acts as a crucial diagnostic tool, providing insights into nerve integrity, muscle functionality, and the general health of the neuromuscular unit.
Types of Strength-Duration Curve
Normal Innervation
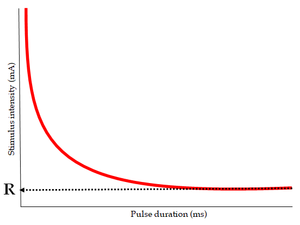
Also known as a “nerve curve,” this type denotes that all nerve fibers supplying the muscle are intact. The curve adopts the form of a continuous rectangular hyperbola. The same intensity is needed to elicit a response over extended durations, while the intensity gradually increases with shorter durations. Typically, the curve begins rising around the 1 ms mark.
This curve represents a muscle that has normal innervation.
Complete Denervation
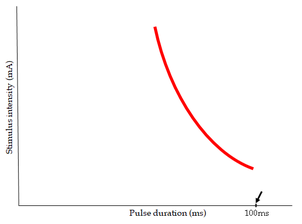
This condition is referred to as a “muscle curve.” All the nerve fibers that supply the muscle have deteriorated. The curve is typically steep and has shifted to the right. The intensity continues to rise when the duration is decreased below 100ms. No response is observed at very brief durations.
This curve illustrates a muscle that is fully denervated.
Partial Denervation
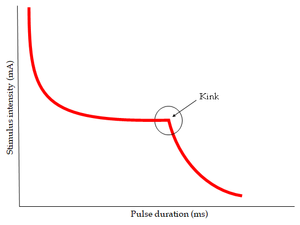
Some nerve fibers supplying the muscles have deteriorated while others remain intact. A distinctive kink is evident in the curve. The right segment of the curve represents the denervated portion of the muscle, while the left segment illustrates the innervated fibers of the muscle.
This curve represents a muscle that is partially denervated.
Foundations of the SD Curve: Physiology and Electrophysiology
The SD curve is based on the essential concepts of muscle physiology and electrophysiology. Muscle contraction begins with the depolarization of the muscle cell membrane, triggering a series of events that ultimately result in the interaction of actin and myosin filaments. This depolarization can occur through various mechanisms, including the arrival of a nerve impulse at the neuromuscular junction or, as seen with the SD curve, through an external electrical stimulus.
When an electrical stimulus is applied to a muscle, it activates both the nerve fibers that innervate the muscle and the muscle fibers themselves. The intensity and duration of the stimulus are crucial elements that influence whether a muscle contraction will take place. The SD curve effectively illustrates this relationship.
Stimulus Intensity: This refers to the strength of the electrical current, usually measured in milliamperes (mA) or volts (V). A stronger intensity stimulus typically recruits more nerve and muscle fibers, thereby enhancing the chances of a contraction.
Stimulus Duration: This term indicates the amount of time the electrical current is applied, generally measured in milliseconds (ms). A longer-duration stimulus permits more prolonged depolarization of both the nerve and muscle membranes, which also raises the probability of a contraction.
The SD curve is formed by systematically altering the stimulus duration and identifying the minimum intensity needed to achieve a noticeable muscle contraction for each duration. These data points are then charted on a graph, with stimulus intensity represented on the vertical axis and stimulus duration along the horizontal axis.
The Shape and Characteristics of the SD Curve: Deciphering the Code
In a normal individual, the SD curve displays a distinct hyperbolic shape. It begins with a steep incline on the left side, indicating that high intensities are needed to provoke a contraction from short-duration stimuli. As the stimulus duration increases, the necessary intensity decreases, and the curve gradually levels off, ultimately reaching a plateau.
Several key parameters can be derived from the SD curve, each offering important insights into the neuromuscular system:
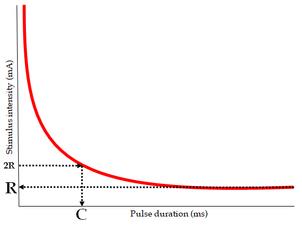
Rheobase: This describes the minimum intensity of a long-duration stimulus (usually defined as durations exceeding 10ms) required to elicit a muscle contraction. It reflects the excitability of the muscle membrane and is mainly affected by the characteristics of the muscle fibers themselves.
Slope of the Curve: The steepness of the initial part of the curve offers information on the recruitment of nerve and muscle fibers. A steeper slope implies a more uniform population of fibers with similar excitability.
Utilization Time: This represents the duration taken by a stimulus at the basic strength to stimulate the nerve and induce muscle contraction. Below this threshold, no muscle contraction will occur.
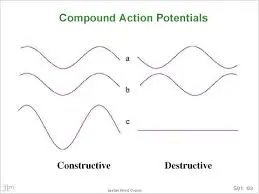
Compound Action Potential
Strength-Duration Curve
This section of the lab aims to investigate the relationship between stimulus strength and stimulus duration in the activation of nerves and to create a Strength-Duration Curve.
Background
We’ve observed how the shape, height, and length of the CAP change as stimulus strength increases because stronger stimulation engages more individual nerve fibers, whose individual action potentials combine to produce a CAP. Therefore, as the stimulus becomes more intense, a greater number of fibers reach their activation threshold.
However, a fiber’s activation threshold is influenced not only by the strength of the stimulus but also by its duration.
To depolarize an excitable membrane, a flow of electrical charge must move across the membrane. Due to the membrane’s significant electrical capacitance, the total quantity of charge transferred across the membrane is the crucial factor for effective membrane depolarization.
For a brief duration stimulus generating a constant trans-membrane current, the charge (Q) that gets transferred is proportional to the product of current (I) and time (T):
Q = I x T
Thus, if the amount of charge necessary for fiber activation is defined as Qt, and the stimulus duration is labeled as D, the current (It) needed to achieve this activation will be:
It = Qt / D
This indicates that a plot of threshold stimulus strength against stimulus duration should trend downward to nearly zero with increased stimulus duration. In other words, the stimulus strength necessary to reach the threshold should diminish with prolonged stimulation. It is important to note that voltage (V) and current (I) can be used interchangeably as measures of stimulus strength.
The Strength-Duration Curve for a typical neural membrane exhibits some similarities but also diverges in that the curve notably levels off with extended stimulus durations, achieving a limiting value called the RHEOBASE. When the stimulus strength falls below the rheobase, stimulation fails to be effective even with very long stimulus durations.
The difference between the observed shape of the Strength-Duration curve and the prediction from the equation above arises from the fact that the predicted relation holds for an ideal capacitor with no leakage resistance. During prolonged stimulation (large values of t), the equation is unable to accurately estimate the charge transfer across the nerve membrane since under these circumstances, the actual charge transfer is lower than predicted due to leakage caused by the significant electrical resistance of the membrane.
Thanks to the interaction between resistive and capacitive effects within the membrane, charge transfer (and membrane potential) rises exponentially to a plateau during long stimulation instead of increasing linearly over time. Therefore, if the stimulus is inadequate, the membrane potential fails to reach the threshold.
When analyzing the Strength-Duration relationship in a nerve trunk that contains numerous nerve fibers, one must take care to identify which specific fibers the threshold pertains to. The threshold stimulus voltage for the entire CAP effectively corresponds to the threshold of the fastest, most responsive fibers in the nerve. As accurately determining this threshold is challenging, the outlined procedure employs a reference signal where the peak amplitude of the CAP is about one-fifth of its maximum. Consequently, this threshold represents that of another, less excitable group of fibers.
Procedure
To start, the stimulator’s knob is adjusted to set the stimulus duration at 1.0 ms.
STEP A: Gradually increase the stimulus voltage until a compound action potential (CAP) is detected. In this instance, we adjusted the voltage until the CAP amplitude fills two segments of the horizontal grid displayed on the screen. This CAP amplitude will serve as a benchmark for the remainder of the experiment. (Alternatively, another reference line can be selected, as long as it is consistently maintained throughout the procedure.)
We note the stimulus voltage from the stimulator, as well as the corresponding stimulus duration (in this initial case, 1 ms), and record this pair of values in a table. Thus, this combination of stimulus duration and voltage has reached the threshold for a small group of excitable nerve fibers, although they are not the most excitable.
STEP B: Next, we gradually decrease the stimulus duration until the CAP is no longer visible. (We cease when the display indicates a flat line where the CAP was previously observed.)
Then, we repeat STEP A; that is, we increase the stimulus voltage until the CAP reaches the previously noted reference amplitude. (This corresponds to filling two intervals of the grid.) We document the new stimulus voltage and stimulus duration from the stimulator and record this pair of values in our table.
This entire procedure is iterated until we have obtained 10 distinct pairs of values. Using our collected data, we can plot the strength-duration curve:
In addition to identifying the Rheobase, the Strength-Duration Curve offers another significant piece of information known as the Chronaxie. The Chronaxie is a duration measurement that represents twice the Rheobase.
From the graph above, the Rheobase is approximately 0.64 volts, while the Chronaxie measures around 0.16 ms.
Clinical Applications of the SD Curve: A Window into Neuromuscular Disorders
The SD curve has numerous applications in diagnosing, predicting, and managing various neuromuscular disorders. Its capability to distinguish between nerve and muscle dysfunction makes it an essential resource in clinical settings.
Peripheral Nerve Injuries: The SD curve is especially beneficial for evaluating the extent and severity of peripheral nerve injuries. After a nerve injury occurs, the SD curve exhibits specific alterations. In instances of nerve conduction block (where the nerve signal is impeded, but the nerve fibers remain intact), the curve may initially shift rightward, necessitating higher stimulation intensities to activate the muscle.
Nevertheless, the chronaxie may largely remain unchanged. Conversely, in situations of axonal degeneration (where the nerve fibers are damaged), the curve shifts further to the right, and there is a notable increase in the chronaxie. The degree of these modifications aids clinicians in assessing prognosis and directing treatment plans. Serial measurements of the SD curve can also be utilized to observe nerve regeneration and recovery.
Muscle Disorders: The SD curve can be employed to assess muscle functionality across various muscle disorders. In conditions such as muscular dystrophy, where muscle fibers progressively deteriorate, the SD curve may demonstrate a rightward shift and a reduction in rheobase, indicating diminished excitability of the muscle tissue. In myasthenia gravis, an autoimmune disorder affecting the neuromuscular junction, the SD curve may exhibit a characteristic “fatigue” pattern, wherein the intensity required to trigger a contraction escalates with repeated stimulation.
Neuromuscular Junction Disorders: Disorders that affect the neuromuscular junction, such as Lambert-Eaton syndrome, can also influence the SD curve. These conditions often interfere with the release of acetylcholine, the neurotransmitter essential for muscle activation, resulting in alterations in muscle excitability and contractility as reflected in the SD curve.
Monitoring Neuromuscular Diseases: In progressive neurological disorders like Amyotrophic Lateral Sclerosis (ALS), the SD curve can be useful for tracking the decline in motor neuron function and muscle strength. Changes in the parameters of the curve can yield valuable insights into disease progression and treatment responses.
Guiding Rehabilitation Strategies: The SD curve can play an important role in customizing rehabilitation programs for individuals with neuromuscular disorders. For example, in patients suffering from peripheral nerve injuries, the SD curve can help identify the most effective parameters for electrical stimulation therapy, facilitating nerve regeneration and muscle strengthening.
Technical Considerations and Limitations of the SD Curve
Although the SD curve is a useful tool, it is important to recognize its constraints and the technical elements that may affect its precision and interpretation.
Electrode Placement: The positioning of the stimulating electrodes is vital. Electrodes should be placed deliberately to specifically stimulate the intended muscle or nerve. If electrode placement is inconsistent, it can result in variability in the recorded data.
Stimulus Parameters: In addition to intensity and duration, other stimulus factors, such as waveform and frequency, may also affect the muscle response. Standardized stimulation protocols are necessary for obtaining reliable and comparable results.
Patient Cooperation: The assessment of the SD curve requires the cooperation of the patient since they must perceive and report minimal muscle contraction. Factors such as pain, anxiety, or cognitive impairment can compromise the reliability of the test.
Subjectivity: Identifying the minimal muscle contraction can be somewhat subjective, particularly for weak or subtle contractions. This subjectivity may introduce variability into the data.
Limited Specificity: While the SD curve is capable of detecting neuromuscular dysfunction, it might not always be able to identify the specific underlying issue. Additional investigations, like nerve conduction studies and electromyography (EMG), may be required for a conclusive diagnosis.
Technical Expertise: Conducting and interpreting the SD curve necessitates specialized training and expertise. Insufficient training can lead to incorrect results and misinterpretations.
Advancements and Future Directions
Regardless of its limitations, the SD curve continues to be a valuable asset in both clinical practice and research. Ongoing technological and methodological advancements are further enhancing its usefulness.
Automated SD Curve Measurement: Automated systems for measuring the SD curve are being developed to minimize subjectivity and increase testing efficiency.
Integration with other Electrodiagnostic Techniques: Merging the SD curve with other electrodiagnostic methods, like nerve conduction studies and EMG, can yield a more thorough assessment of the neuromuscular system.
Quantitative Analysis of SD Curve Data: The creation of more advanced techniques for analyzing SD curve data can provide more objective and quantitative evaluations of neuromuscular function.
Applications in Sports Medicine and Rehabilitation: The SD curve has potential uses in sports medicine and rehabilitation, such as monitoring muscle fatigue, evaluating muscle recovery following injury, and optimizing training plans.
- Factors Affecting the Strength-Duration Curve
- Skin resistance
- Subcutaneous tissue such as fat
- Temperature
- Electrode size, material, and placement
- Age of the subject
- Fatigue
How would the strength-duration curve for a set of slow fibers (not very excitable) compare to the strength-duration curve for a set of quick fibers (very excitable)?
The curve for the slower fibers would be shifted to the right, indicating that a longer stimulus duration is required to reach the threshold with a given stimulus strength.
Advantages of the Strength-Duration Curve
It is quick and straightforward to perform. It needs minimal training. It is cost-effective compared to other clinical tests.
Disadvantages of the Strength-Duration Curve
It only provides qualitative data regarding the degree of denervation. It cannot determine the location of the lesion. In larger muscles, only a limited number of fibers can be examined due to the method’s constraints.
Clinical Significance
It assesses the excitability of the nerve and thus, can indicate the extent of nerve damage. It can demonstrate recovery over time. It serves as a valuable diagnostic and prognostic tool. It is typically conducted after three weeks of nerve injury to allow for Wallerian degeneration.
The interrater reliability (r = .541) is lower than the interrater reliability (r = .945), which has been linked to normal physiological variations among subjects.
Conclusion
The SD curve serves as an important resource for evaluating neuromuscular health and performance. It offers essential insights into the functionality and responsiveness of the nerves and muscles, which can be beneficial in diagnosing, treating, and tracking various conditions. Although the SD curve has specific drawbacks, its uses in a clinical setting are extensive, making it a crucial instrument in neuromuscular medicine.
The Strength-Duration curve, although conceptually simple, offers significant insight into the complex realm of neuromuscular physiology. Its capacity to differentiate between nerve and muscle dysfunction makes it an essential instrument in the diagnosis and treatment of various neuromuscular disorders.
While recognizing its limitations and the technical factors that may affect its interpretation, the SD curve remains a fundamental component of electrodiagnostic testing, contributing greatly to our understanding of neuromuscular health and disease. Ongoing research and technological advancements are likely to further refine and broaden the applications of this enduring tool, ensuring its continued importance in the field of neuromuscular medicine.
FAQs
What is the SD curve?
[Purpose] Strength-duration (SD) curves are utilized in electrical assessments by physiotherapists to verify muscle degeneration. Nevertheless, the extent to which SD curves are beneficial for comparing muscle degeneration in DJ-1 homozygous knockout (DJ-1−/−) versus wild-type mice (DJ-1+/+) remains incompletely understood.
What is the SD of a curve?
How to Calculate Standard Deviation (Guide)
The distribution’s degree of dispersion is indicated by the standard deviation. A curve with a smaller standard deviation has a tall peak and a narrow spread, whereas a curve with a higher standard deviation appears flatter and more widely spread.
What is the SD curve on a facial nerve?
Strength – Duration (SD) Curve
The creation of a strength-duration curve illustrates the strength of an impulse of varying durations necessary to trigger a muscle contraction. It is straightforward and reliable. It indicates the degree of denervation but cannot specify the location of a nerve injury.
What is the use of the strength-duration curve?
In this context, strength refers to the intensity of the stimulus displayed on the vertical axis, while duration signifies the pulse length represented on the horizontal axis. It is employed to assess nerve damage associated with lower motor neuron injuries.
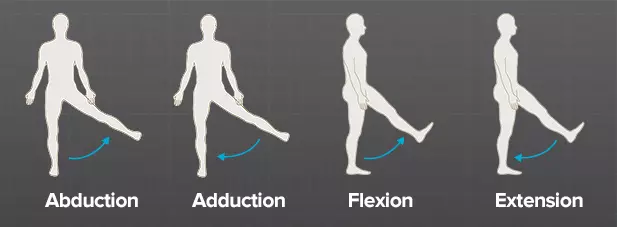
What is a strength curve?
It represents the relationship between muscle fibers within a joint and the amount of force they can generate at specific angles. This curve can be divided into three primary components: the stretched position of the muscle, the mid-range position, and the shortened position.
References
- n.d. https:/www.physio-pedia.com/Strength-Duration_Curve
- Strength-duration curve. (n.d.).
- https://www.medicine.mcgill.ca/physio/vlab/Other_exps/CAP/S-D.htm
- A Case Study of Electrical Stimulation for the Treatment of Facial Nerve Damage After TMJ Surgery. Biomedical and Pharmacology Journal.
- https://biomedpharmajournal.org/vol10no4/facial-nerve-injury-following-tmj-surgery-and-its-management-by-electrical-stimulation-a-case-study/#:~:text=Strength